
Retention Rate vs Turnover Rate – 5 Key Differences Explained
Retention rate vs turnover rate is one of the most common points of confusion in workforce reporting, because both metrics describe people staying and leaving but measure different things.
Retention rate tells you how many of your existing employees stayed over a set period, while turnover rate tracks how many people left relative to your average headcount. Treating one as the inverse of the other can hide real problems in your workforce.
Today, we will explain what each metric means, where they differ, how to calculate both, and what a healthy benchmark looks like.
Turnover Rate vs Retention Rate – Key Takeaways
- Retention rate measures the share of employees at the start of a period who stayed through the entire period. New hires are excluded
- Turnover rate divides separations by average headcount, and it counts everyone who left, including new hires
- The two metrics are not opposites, so adding them together rarely equals 100%
- Retention is usually reviewed annually, while turnover is tracked monthly or quarterly to catch problems early
- Tracking both gives a fuller view of workforce stability, hiring quality, and engagement
What Is Employee Retention Rate?
Employee retention rate is the percentage of employees who remain with your organization from the start to the end of a defined period, usually a year. It only counts people who were already on payroll when the period began, so anyone hired partway through is left out of the calculation.
Because it tracks the same group of people from start to finish, retention rate shows how well you hold on to the workforce you already have. A high rate suggests employees are engaged, fairly paid, and see a future with the company. A falling rate is often an early signal that pay, management, or career growth needs attention.
What Is Employee Turnover Rate?
Employee turnover rate is the percentage of employees who leave your organization during a period, measured against your average headcount for that period. It captures every type of departure, from resignations to terminations.
Turnover is usually split into two types:
- Voluntary turnover – employees who choose to leave, such as resigning for another role, relocating, or retiring
- Involuntary turnover – separations the employer initiates, such as terminations for performance, layoffs, or restructuring
Many HR teams also track regrettable turnover, meaning the loss of high performers the business wanted to keep. This subset is often the most useful number for spotting retention risks.
Retention Rate vs Turnover Rate – 5 Key Differences
The clearest way to understand turnover vs retention rate is to compare what each one counts, how often it is measured, and what it tells you about your workforce.
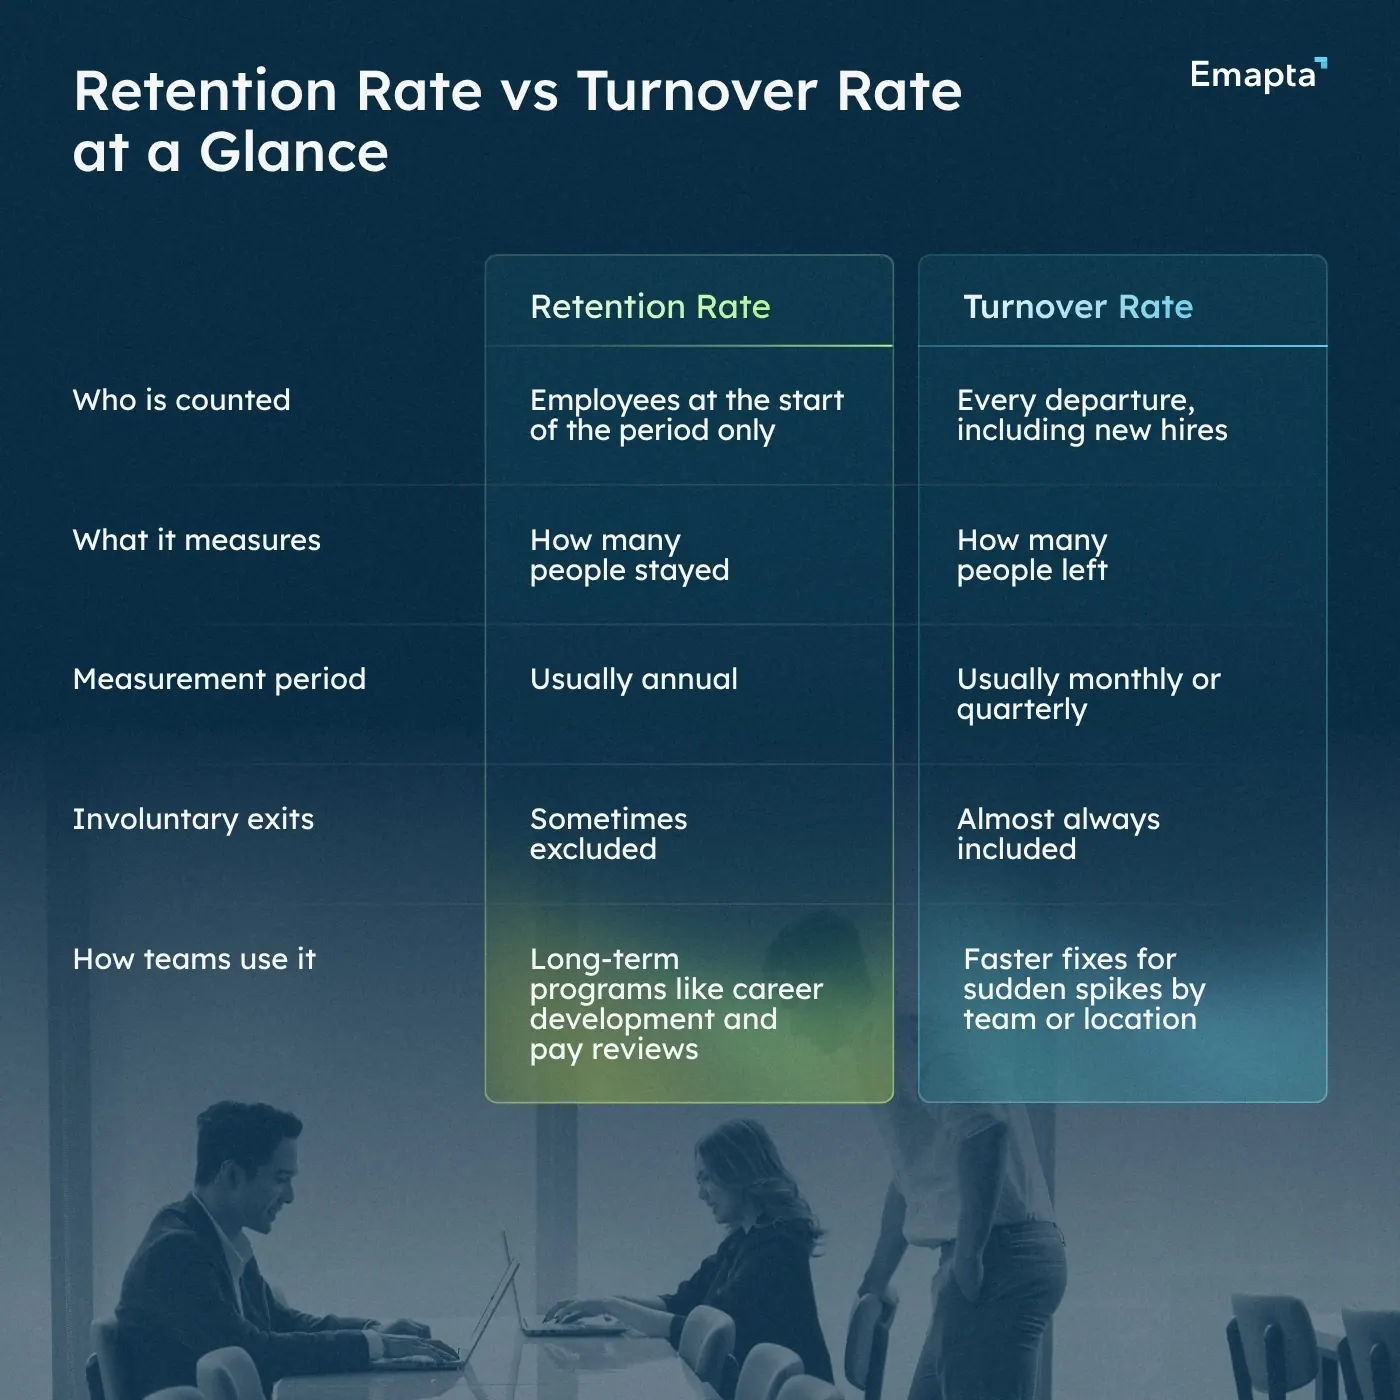
1. Who Is Counted
Retention rate follows only the employees present at the start of the period. Turnover rate counts every departure, so a new hire who leaves after three months affects turnover but never touches your retention figure.
2. What Each Metric Measures
Retention rate measures how many people stayed, which makes it a stability metric. Turnover rate measures how many people left, which makes it a movement metric that reflects churn across the whole workforce.
3. Measurement Period
Retention is typically calculated annually because it is meant to show long-term stability. Turnover is usually tracked monthly or quarterly so teams can spot spikes, such as departures after a reorganization or bonus payout, while there is still time to respond.
4. What the Results Reveal
Turnover rate almost always includes both voluntary and involuntary separations, since it is meant to capture all workforce movement. Retention is more flexible. Some companies exclude terminations and layoffs so the figure reflects only the people who chose to leave, so check which method your organization uses before comparing results across teams or years.
5. How Teams Act on Them
Retention insights tend to shape long-term programs like career development, compensation reviews, and manager training. Turnover data drives faster fixes, especially when a single team or location shows a sudden rise. For distributed workforces, it also helps to review how you approach managing remote teams, since isolation and unclear expectations are common reasons remote employees leave.
This is why a turnover rate vs retention rate comparison should never assume the two numbers mirror each other. The worked examples below show exactly how they diverge.
How to Calculate Employee Retention Rate?
Before you start, choose a measurement period and pull headcount reports from your Human Resources Information System (HRIS) for the first and last day. The retention rate formula is:
Retention rate = (Employees who stayed the entire period ÷ Employees at the start of the period) × 100
Say a company starts the year with 200 employees. During the year, 20 of those original employees leave, and the company hires 30 people, four of whom also leave before year-end.
Only the original 200 count here, and 180 of them stayed the full year: 180 ÷ 200 × 100 = 90% retention
A common mistake is dividing end-of-year headcount by starting headcount. In this example, that would give 206 ÷ 200, or 103%, because new hires get mixed into the result. Calculating employee retention rate accurately matters even more when you break results down by team, manager, or location, where small headcounts can swing the numbers quickly.
Want a Deeper Look at Retention?
Get the formulas, common calculation mistakes, and practical ways to keep your best people longer.

How to Calculate Employee Turnover Rate?
The key thing to know about calculating employee turnover rate is that it uses average headcount instead of starting headcount, because the size of your workforce shifts as people join and leave. The turnover rate formula is:
Turnover rate = (Number of separations ÷ Average number of employees) × 100
To find average headcount, add your headcount at the start and end of the period and divide by two. For monthly tracking, calculate each month separately and add the results together for an annual figure.
Using the same company, there were 24 total separations: 20 original employees plus four new hires. Headcount moved from 200 to 206, for an average of 203: 24 ÷ 203 × 100 = 11.8% annual turnover
Notice that 90% retention and 11.8% turnover add up to more than 100%. That gap comes from the new hires who left, which turnover captures and retention ignores.
For context, according to the U.S. Bureau of Labor Statistics (BLS), the average monthly total separations rate across U.S. employers was 3.3% in 2025, with annual separations totalling 62.8 million. Rates vary widely by industry, so compare your turnover against sector peers rather than the national figure
Why Should Companies Track Both Metrics?
Reviewing employee retention rate vs turnover rate side by side shows where workforce problems actually start. Each metric alone leaves blind spots, but together they reveal whether issues sit with long-tenured staff, recent hires, or both.
Here is how to read the most common combinations:
- High retention, low turnover – a stable, engaged workforce with effective hiring.
- High retention, high turnover – core staff are staying, but new hires leave early, which often signals hiring fit or onboarding gaps.
- Low retention, high turnover – a broader engagement, management, or culture issue that needs urgent attention
Ignoring these signals is expensive. Gallup estimates that replacing leaders and managers can cost around 200% of their salary, while replacing employees in technical roles costs around 80% and frontline employees around 40%. Gallup also found that 42% of employees who voluntarily left said their manager or organization could have done something to prevent them from leaving.
Retention and turnover data also matter for long-term planning. Organizations going through transformation often rely on these metrics to decide which roles to restructure, where to source talent, and how to support teams through change.
What Is a Good Retention and Turnover Rate?
There is no universal benchmark for retention rate vs turnover rate because acceptable levels vary by industry, role mix, workforce model, and growth stage. A 10% annual turnover rate may be reasonable for some professional workforces but unusually low for industries with high employee movement, such as retail and hospitality. The most useful comparison is against organizations with similar roles, industries, and workforce structures.
How Benchmarks Vary by Industry
Industries with large hourly or seasonal workforces, such as retail and hospitality, routinely run much higher turnover. Specialized roles in technology, finance, or healthcare usually warrant tighter targets, since each departure is harder and costlier to replace.
Why Your Own Trend Line Matters Most
The most useful benchmark is often your own historical data. Track both rates over several periods and break them down by team, manager, and tenure to see where movement is concentrated. Pairing these numbers with exit interviews and engagement surveys helps explain why the rates are changing, not just that they are.
How Offshore Team Support Affects Retention
For enterprises with offshore teams, retention often depends on how well employees are supported day to day. Clear career paths, competitive benefits, reliable equipment, and responsive HR support all influence whether offshore staff stay long-term, just as they do for in-house teams.
Many companies work with an outsourcing partner that manages HR, compliance, IT, and facilities locally, so leaders can focus on directing the work and building relationships with their team. When comparing partners, it helps to ask about their own retention rates and how they keep employees engaged on the ground.
Conclusion
Retention and turnover answer different questions. Retention shows how well you keep the people you already have, while turnover shows how much movement your whole workforce experiences, including early exits by new hires.
Calculating both correctly, reviewing turnover often, and comparing results over time gives you a far clearer view of workforce health than either number alone. The real value of tracking retention rate vs turnover rate comes from using both metrics to decide where to act first.
Frequently Asked Questions (FAQ)
Retention rate measures the percentage of employees at the start of a period who stayed through the entire period. Turnover rate measures the percentage of employees who left, relative to average headcount. Retention excludes new hires, while turnover counts every separation.
No. Retention only follows employees who were there at the start of the period, while turnover counts every departure, including new hires who leave quickly. That difference means the two rates rarely add up to 100%, and the gap grows when early exits are high.
Divide the number of employees who stayed for the entire period by the number of employees at the start of the period, then multiply by 100. Do not include anyone hired during the period.
Divide the total number of separations during the period by your average headcount, then multiply by 100. Average headcount is usually your starting and ending headcount added together and divided by two.
Many organizations treat an annual retention rate of around 90% as a healthy target. The right figure depends on your industry, role mix, and growth stage, so your own trend over time is often a more useful benchmark than a single number.