
17 Income Tax Facts and Statistics That May Surprise You
Millions of people pay income taxes every year. Probably zero are happy about it. All jokes aside, taxes help keep countries running. But what do income tax facts really tell us?
Do the wealthy really pay most of the taxes? Why do millions of Americans owe no federal income tax? And does a bigger paycheck always mean a higher tax rate?
We looked at U.S. and global tax data to see how the tax burden is distributed, who actually pays the most, and which common beliefs don’t quite hold up.
What Are the Key Income Tax Statistics?
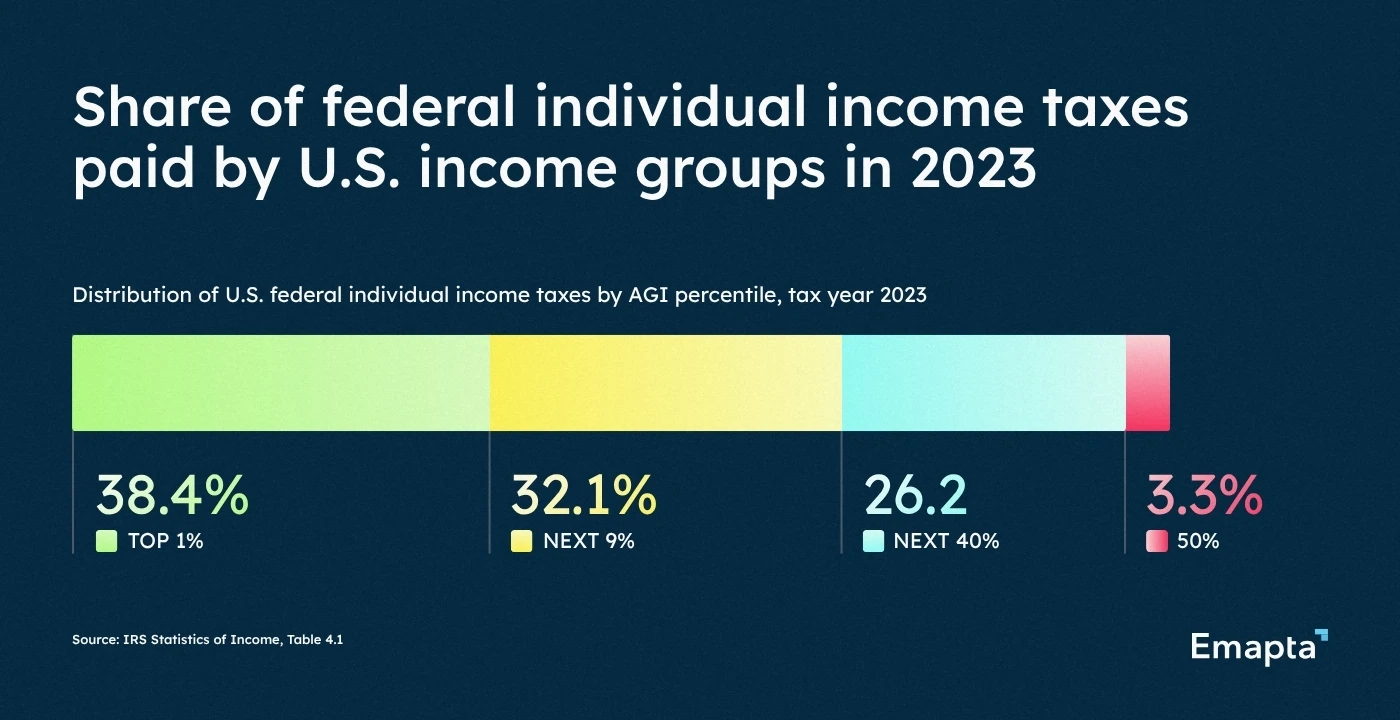
- The top 1% of U.S. tax filers paid 38.4% of federal individual income taxes in 2023.
- More than 49 million U.S. tax returns (30.5%) had no federal income tax liability in 2023
- Personal income tax generated 18.2% of total tax revenue across 38 Asia-Pacific economies in 2024
- The average U.S. tax refund reached $3,276 in 2026, up 11.5% from the previous filing season
- 93.7% of U.S. individual income tax returns were filed electronically in fiscal year 2025
- Eight U.S. states had no individual state income tax in 2026
What Do Global Income Tax Statistics Show?
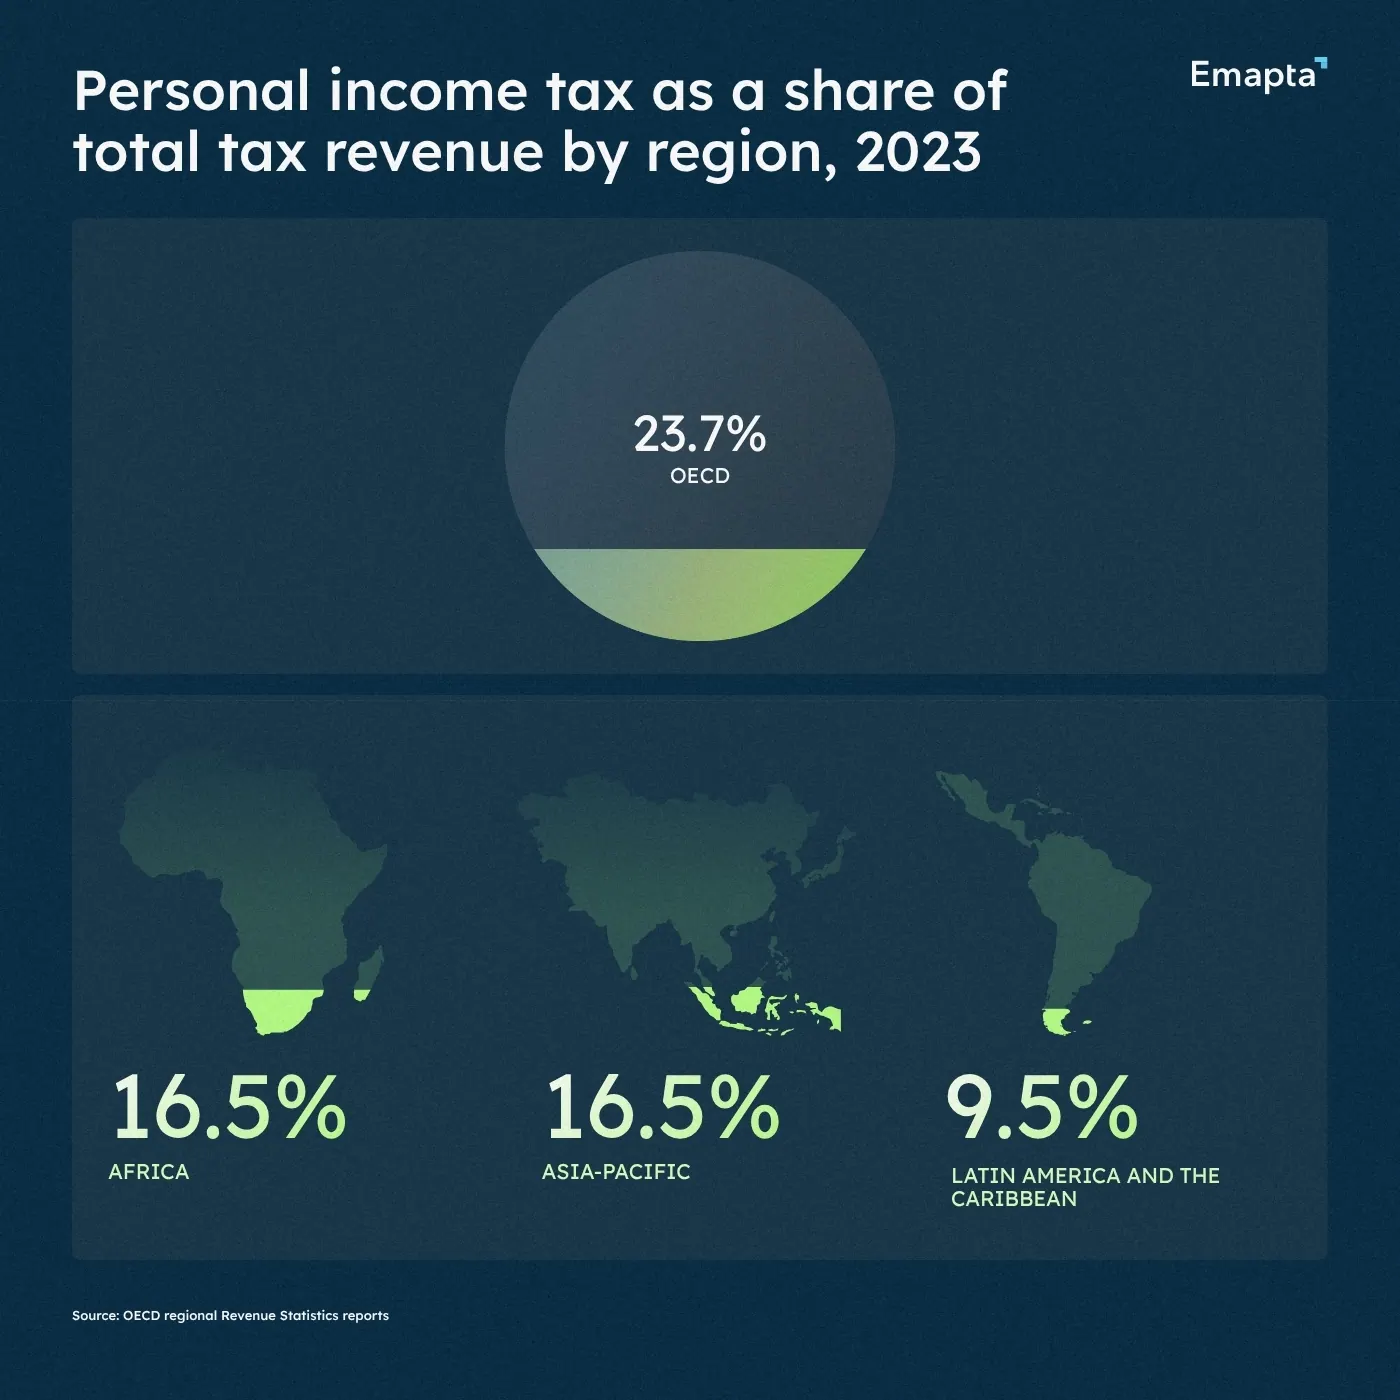
According to the OECD Global Revenue Statistics Database, which covers more than 130 economies worldwide, personal income tax accounts for 24% of tax revenue in OECD countries, 16% in Africa and Asia-Pacific, and 9% in Latin America and the Caribbean.
1. Personal Income Tax Made Up 9.5% to 23.7% of Tax Revenue Across Four Regional Groups.
Looking at the regions, personal income tax accounted for the following shares of total tax revenue in 2023:
- OECD countries: 23.7% (38 member countries)
- Africa: 16.5% (38 countries covered)
- Asia and the Pacific: 16.5% (37 economies covered)
- Latin America and the Caribbean: 9.5% (27 countries covered)
One of the most interesting facts about income tax is that developed countries have a higher share of total tax revenue. According to the IMF, it is due to higher incomes, formal employment, and stronger tax administration. On the other hand, in developing economies, lower earnings and widespread informal employment often reduce the number of people paying it.
Source: OECD Global Revenue Statistics Database
2. Personal Income Tax Revenue Rose From 7.3% to 8.2% of OECD GDP.
Personal income tax became a more important source of government revenue across OECD countries between 2011 and 2023. As a share of GDP, it increased from:
- 2011: 7.3%
- 2023: 8.2%
The OECD has 38 member countries, accounting for approximately 61% of global nominal GDP in 2025. Overall, 31 of those countries reported an increase in personal income tax revenue as a percentage of GDP during this period. This is likely due to higher incomes, employment growth, and changes in tax policy.
Source: OECD Revenue Statistics 2025
3. Personal Income Tax Generated 18.2% of Asia-Pacific Tax Revenue in 2024.
Personal income tax accounted for 18.2% of total tax revenue across 38 Asia-Pacific economies in 2024. The study includes strong economies like China, Japan, and Australia, but not India.
Strong exports, investment, and recovering tourism supported economic growth and tax collection across the region.
Source: OECD Revenue Statistics in Asia and the Pacific 2026
How Do Income Tax Statistics Compare by Country?
In 2023, personal income tax revenue ranged from 1.4% to 25.2% of GDP across OECD members (38 member countries, accounting for approximately 61% of global nominal GDP in 2025). In the U.S., higher earners pay most federal individual income taxes: the top 1% accounted for 38.4% in 2023, while the highest-income half paid 96.7%.
4. Personal Income Tax Revenue Ranges From 1.4% to 25.2% of GDP Across OECD Countries.
Personal income tax revenue varies considerably between countries. In 2023, OECD and Asia-Pacific revenue data showed these examples:
- Denmark: 25.2% of GDP, the highest among OECD members
- New Zealand: 14.3% of GDP
- Costa Rica: 1.4% of GDP, the lowest among OECD members
- Maldives: 0.4% of GDP, the lowest among the economies covered by the 2025 Asia-Pacific report
The OECD average was 8.2% of GDP.
Sources: OECD Revenue Statistics 2025 and Revenue Statistics in Asia and the Pacific 2025
5. The Top 1% of U.S. Tax Filers Paid 38.4% of Federal Income Taxes.
The highest-income 1% of U.S. tax filers paid 38.4% of federal individual income taxes in 2023.
This relatively small group accounted for:
- 20.6% of total reported adjusted gross income
- 38.4% of federal individual income tax payments
- Approximately $823.4 billion in federal individual income taxes
To enter the top 1%, a tax return needed at least $675,602 in adjusted gross income.
Source: Tax Foundation
6. The Top 50% of U.S. Tax Filers Paid 96.7% of Federal Income Taxes.
The highest-income half of U.S. tax filers pays 96.7% of federal individual income taxes. The remaining half accounts for just 3.3%.
The dividing line between the groups was approximately $53,801 in AGI (Adjusted gross income). The highest-income 10% alone paid 70.5% of federal individual income taxes.
Source: National Taxpayers Union Foundation
7. The Top 1% Paid an Average Federal Income Tax Rate of 26.3%.
Higher-income filers not only paid a larger share of total federal income taxes in 2023. They also paid a higher average percentage of their reported AGI.
The IRS figures show the following average rates:
Income group, Average federal income tax rate
- Top 1%, 26.3%
- Top 5%, 23.0%
- Top 10%, 20.9%
- Top 25%, 17.8%
- Top 50%, 15.6%
- Bottom 50%, 3.7%
Source: National Taxpayers Union Foundation
8. More Than 49 Million U.S. Tax Returns Had No Federal Income Tax Liability.
How many taxpayers are in the U.S.? The IRS received approximately 160.6 million individual income tax returns for tax year 2023. More than 49 million returns (30.5%) had no federal individual income tax liability.
Source: National Taxpayers Union Foundation
9. Eight U.S. States Have No State Income Tax.
In 2026, eight U.S. states have no individual state income tax: Alaska, Florida, Nevada, New Hampshire, South Dakota, Tennessee, Texas, and Wyoming.
Source: Tax Foundation
10. Income Tax Statistics by Age Show the Highest Average Payments Among Adults Aged 45–54.
Americans aged 45–54 paid the most federal income tax in 2023, averaging $17,381 per household. By comparison, those under 25 paid $3,573.
The age breakdown shows:
- Under 25: $3,573
- 25–34: $8,778
- 35–44: $13,358
- 45–54: $17,381
- 55–64: $16,294
- 65 and older: $4,343
Sources: Federal Reserve Bank:: under 25, 25–34, 35–44, 45–54, 55–64, and 65+.
How Have Income Tax Data Changed by Year?
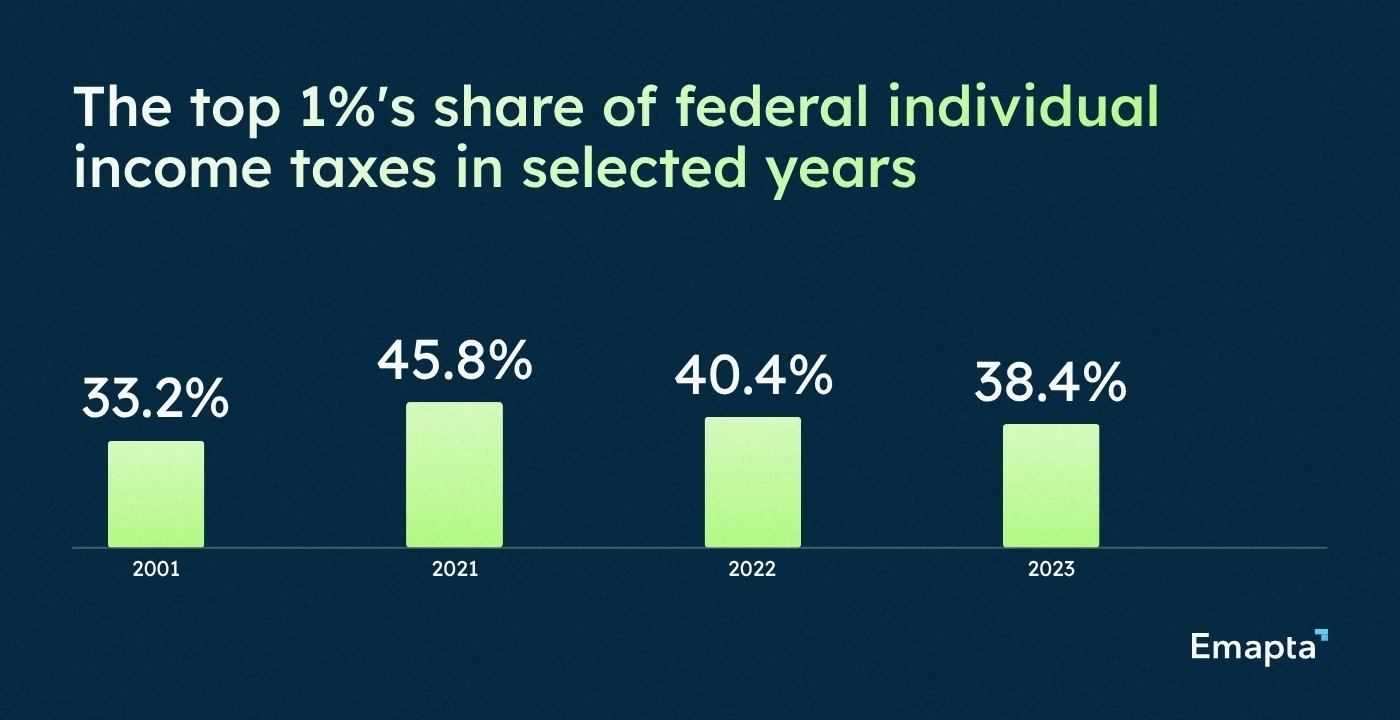
US income tax statistics show that the distribution of federal income tax payments changes considerably over time – the top 1% paid 33.2% of federal individual income taxes in 2001, 45.8% in 2021, and 38.4% in 2023.
11. The Top 1%’s Share of Federal Income Taxes Rose From 33.2% to 38.4% Between 2001 and 2023.
The share of federal individual income taxes paid by the top 1% increased from 33.2% in 2001 to 38.4% in 2023.
Over the same period, the group’s share of total reported AGI increased from 17.4% to 20.6%.
Source: Tax Foundation
12. The Top 1%’s Share of Federal Income Taxes Reached 45.8% in 2021.
The share of federal individual income taxes paid by the top 1% fluctuated considerably in recent years:
- 2021: 45.8%
- 2022: 40.4%
- 2023: 38.4%
The exceptionally high numbers for 2021 coincided with a sharp increase in realized capital gains and investment-related income.
Source: Tax Foundation
13. The Average Income Tax Refund in 2026 is $3,276.
According to the US income tax return filing statistics, the IRS issued around $324.8 billion in tax refunds by May 8, 2026, an 18.1% increase compared with the corresponding period in 2025.
- 99.1 million refunds, up 6.0%
- $3,276 average refund, up 11.5%
- 145.0 million returns received, down 0.6%
Source: IRS filing season statistics
What Do Income Tax Facts Suggest About the Future?
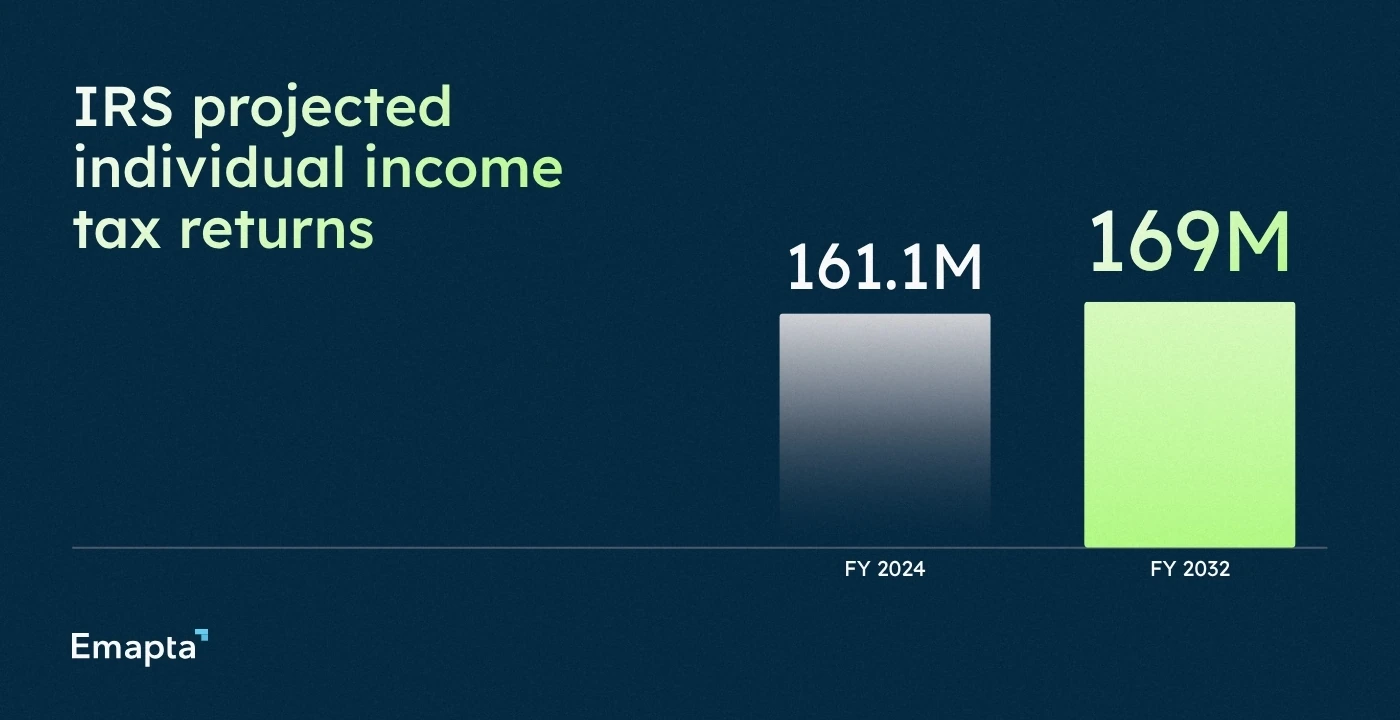
Electronic filing is already the norm in the U.S. By May 8, 2026, the IRS had received 145 million individual tax returns, including 141 million filed electronically. The agency expects annual individual returns to reach 169 million by fiscal year 2032, while the Congressional Budget Office projects income tax revenue rising from 8.6% of GDP in 2026 to 9.1% in 2036.
14. The IRS Projects 169 Million Individual Income Tax Returns in 2032.
The IRS projects approximately 169 million individual income tax returns in fiscal year 2032, up from 161.1 million in 2024. It processed almost 162.8 million returns in fiscal year 2025.
Source: IRS Publication 6292, Fiscal Year Return Projections 2025–2032, 2025 Data Book.
15. Electronic Form 1040 Filings Could Reach 162.8 Million by 2032.
According to income tax stats, electronic filing already accounted for 93.7% of individual income tax returns in fiscal year 2025. Electronic Forms 1040 and 1040-SR filings are projected to increase from approximately 149.5 million in fiscal year 2024 to 162.8 million in 2032.
Electronic filing is expected to become even more dominant as paper submissions decline.
Source: IRS Publication 6292
16. The Standard Deduction for Single Filers Increased to $16,100 in 2026.
The standard deduction for single filers increased to $16,100 for tax year 2026, compared with $15,750 in 2025.
- Single filers: $16,100
- Married filing jointly: $32,200
- Heads of household: $24,150
Source: Tax Foundation
17. Federal Individual Income Tax Revenue Is Projected to Reach 9.1% of GDP by 2036.
According to projections, federal individual income tax receipts will rise from 8.6% of U.S. GDP in fiscal year 2026 to 9.1% in 2036.
Source: Congressional Budget Office
What Do These Income Tax Facts Tell Us?
After looking at all these statistics, one thing is clear: the wealthy pay most of the federal income tax in the U.S., millions owe none, and tax systems differ considerably across countries.
Does knowing this make paying taxes any more enjoyable? Probably not.
For businesses, however, understanding tax obligations is more than an interesting exercise. It is part of keeping finances in order. With finance and accounting outsourcing services, companies can build dedicated teams to support tax preparation, accounting, payroll, and compliance.
Frequently Asked Questions About Income Tax
In the U.S., the highest-income 30% of tax filers paid approximately 89.4% of federal individual income taxes in 2023.
Of the 160.6 million U.S. individual tax returns filed for 2023, approximately 111.6 million (69.5%) had federal income tax liability, while more than 49 million (30.5%) had none. The wealthiest 1% of tax filers paid 38.4% of all federal individual income taxes, while the top 10% accounted for 70.5%. Interestingly, the bottom 50% paid just 3.3% of the total.
The highest-income 10% of U.S. tax filers paid 70.5% of federal individual income taxes in 2023. The top 1% alone paid 38.4%.
U.S. federal income tax rates range from 10% to 37% in 2026, but not all earnings are taxed at the same rate. The amount owed depends on filing status, tax brackets, deductions, and credits. For example, the 2026 standard deduction for a single filer is $16,100
For a single U.S. employee earning $70,000 annually in 2026, claiming the standard deduction and no tax credits, estimated federal income tax is $6,570. Employee Social Security and Medicare taxes add approximately $5,355.
That leaves about $58,075 annually, or $27.92 per hour, assuming 2,080 working hours.
The United Arab Emirates, the Bahamas, and the Cayman Islands have 0% personal income tax on individuals. One of the most interesting income tax facts is that it doesn’t exist in eight U.S. states: Alaska, Florida, Nevada, New Hampshire, South Dakota, Tennessee, Texas, and Wyoming.