
20 Remote Work Statistics & Trends for 2026
The following remote work statistics shed a light on the current view of working from home. Ever since Covid-19 made people switch their offices for their homes, a lot have remained true to this type of a work setting.
Let’s dive into the numbers and see just how many people work remotely and what is the outlook for the future as we go into 2026.
Top 8 Remote Work Trends
- Global average work-from-home days fell from 1.6 per week to about 1.27
- English-speaking economies average 1.5–2 WFH days per week
- Hybrid schedules cut quit rates by about 30%
- Around 100 million workers worldwide now follow hybrid work patterns
- In the Philippines, 74% of surveyed workers prefer hybrid or fully remote roles
- In India’s tech sector, nearly 70% of organizations report using hybrid work models
- More than 1.5 million people in Colombia work through telework, work-from-home, or fully remote arrangements
- The ICT sector in North Macedonia exports about €664 million in services to 37 markets
How Many People Work From Home?
These first figures summarize the core numbers that leaders can use to benchmark their own policies.
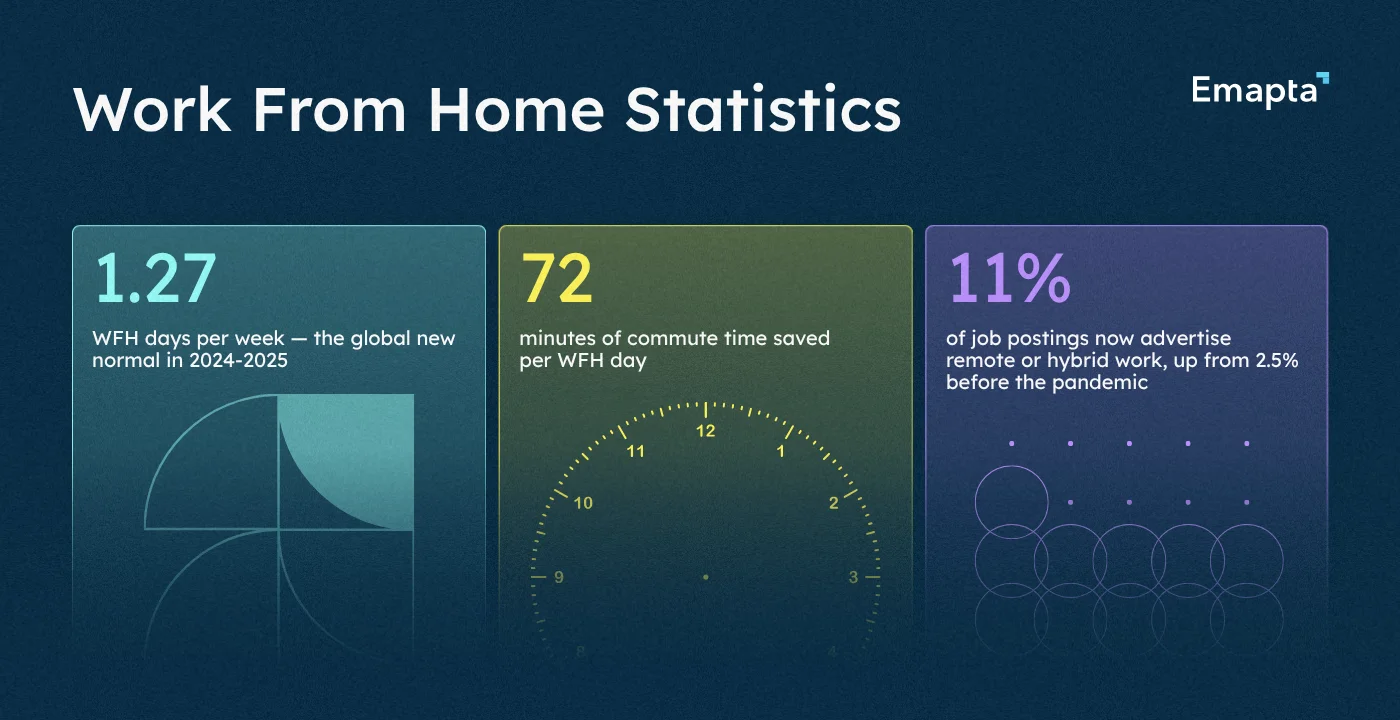
1. Global average WFH days fell from 1.6 in 2022 to 1.27 in 2024–2025.
The Global Survey of Working Arrangements (G-SWA), covering college-educated full-time workers in 22 countries, finds that average work-from-home (WFH) days declined from 1.6 days per week in 2022 to 1.33 days in 2023, and then stabilized at 1.27 days per week in 2024–2025.
Taken together, these remote work statistics show worldwide concrete way to think about the number of WFH people on a typical day in different economies. This pattern supports the idea of a “new normal” where WFH sits at roughly one to one-and-a-quarter days a week for remote-capable talent, rather than continuing to fall back to 2019 levels.
Source: Stanford SIEPR
2. English-speaking economies average 1.5 to 2 WFH days per week vs 0.5 to 1 day in much of Asia.
The same G-SWA data shows a strong regional pattern in WFH intensity among college-educated workers. According to these remote working statistics, these are the numbers in different regions of the world:
- English-speaking countries (such as the US, UK, Australia, Canada) average about 1.5–2 WFH days per week.
- European countries generally sit lower, at around 1–1.5 days per week.
- Latin American and African countries average around 1 day per week.
- Asian countries are lowest, typically 0.5–1 WFH day per week.
Within Latin America, countries such as Colombia are often highlighted for how remote work is expanding their outsourcing potential. These regional differences shape expectations about how often remote-capable employees actually work from home, and they influence where global teams can most easily align with hybrid norms.
These regional patterns are some of the clearest trends in the data: mature English-speaking markets sit near the upper end of hybrid adoption, while Asia’s lower figures show how broader trends in remote work can diverge sharply by region. When organizations compare hiring in APAC with North America or Europe, those gaps translate into very different data and employee expectations.
Source: Stanford SIEPR
3. In the US, remote work rose from 5–7% of paid days in 2019 to about 28% in 2023.
Across multiple US survey series, economists estimate that only about 5–7% of paid workdays were done from home in 2019. During the pandemic, that share surged to more than half of all paid days and then settled at around 28% of paid days by mid-2023.
This level is roughly four to five times higher than before the pandemic, indicating a structural, not temporary, shift in where remote-capable work is performed. In US context, these remote work statistics show that the WFH trend has reset at a much higher baseline than before 2020.
Source: American Economic Association
4. Remote-friendly job ads rose from about 2.5% to around 11% of postings in 20 OECD countries.
A study of job postings from a large multinational platform across 20 OECD countries shows that the share of ads explicitly offering remote or hybrid work:
- Was roughly 2.5% of postings in January 2020.
- Rose to around 11% of postings by January 2023.
- Remained at elevated levels through 2024.
These work from home statistics indicate that remote-capable roles have been built into hiring strategies rather than disappearing as pandemic restrictions eased.
Source: ScienceDirect
5. Working from home saves an average of 72 minutes of commuting per day.
An international survey of workers in 27 countries, analyzed by economists at the US National Bureau of Economic Research (NBER), finds that people save about 72 minutes of commute time on days they work from home. The study estimates that:
- Roughly 40% of that time is reallocated to additional work.
- The rest is split across leisure, childcare, and other non-work activities.
This regained time helps explain why remote-capable roles can sustain significant WFH days without reducing total hours worked. It also underpins many of the remote work productivity statistics, as it often assumes that at least part of the saved commute is reallocated to focused work.
Source: NBER
How Many People Work From Home in the US?
These numbers focus on how remote and hybrid work show up in employee outcomes such as retention, hours worked, and participation patterns across different worker groups. The same evidence base is often used alongside mental health when organizations redesign policies for remote-capable teams.
6. A hybrid trial cut attrition by about 33% with no performance loss.
In a randomized controlled trial involving 1,612 professional employees, some workers were randomly assigned to a hybrid schedule (two days per week at home) while others remained full-time on-site. Over a two-year period:
- Quit rates were about one-third lower in the hybrid group.
- Performance ratings and promotion rates were statistically similar between hybrid and full-time office employees.
These work from home stats portray one of the most rigorously documented large-scale experiments on hybrid work and retention.
Source: SIEPR
7. Around 100 million workers worldwide now follow hybrid work patterns.
Building on survey data and company disclosures, Nicholas Bloom, a Stanford economist and one of the foremost researchers on work-from-home policies and co-authors estimate that around 100 million workers globally now work hybrid schedules, spending part of the week at home and part at a workplace.
Hybrid arrangements typically cluster around 2–3 office days per week for remote-capable roles, with the remainder done from home. As one of the clearest pieces of remote work from home statistics, this estimate helps frame just how many roles are now structured around at least some time away from the office.
Source: ScienceDaily
8. About 40% of US workers with advanced degrees teleworked in early 2024, versus 3–9% with less education.
US Current Population Survey (CPS) data for Q1 2024 show that among workers aged 25 and older:
- 40.4% of workers with an advanced degree did some telework.
- Around 37–38% of those with a bachelor’s degree teleworked.
- Only about 3.5% of workers with less than a high school diploma and around 9% of those with only a high school diploma reported teleworking.
This key work from home trend highlights that remote-capable work is concentrated in higher-skilled, higher-education segments of the labor market, the same segments most often used for offshore and global knowledge teams.
Source: Bureau of Labor Statistics
9. In early 2024, telework made up 16.3% of US work hours, and about 23% of workers did some work from home.
Data from the US Bureau of Labor Statistics (BLS) show that in the first quarter of 2024, telework or work from home for pay accounted for 16.3% of all hours worked, up from about 15.0% a year earlier. Over the same period, the share of people at work who teleworked at least part of the week rose from 19.6% in Q1 2023 to 22.9% in Q1 2024.
A separate BLS work from home trends research paper using Current Population Survey (CPS) data reports that in November 2024, 23.3% of US workers did some work from home for pay and 10.9% worked entirely from home. Taken together, these figures suggest that both the intensity of telework (share of hours) and its prevalence (share of workers) have settled well above pre-pandemic levels.
Source: Bureau of Labor Statistics
10. In November 2024, 23.3% of US workers did some WFH and 10.9% worked entirely from home.
A 2025 BLS research article comparing different surveys reports that, based on CPS data for November 2024:
- 23.3% of US workers performed some work from home for pay.
- 10.9% worked entirely from home.
These remote work stats are consistent with the view that fully remote work remains a substantial minority of arrangements, while hybrid and occasional WFH are widespread among remote-capable employees. Because the analysis was released in 2025, many practitioners treat these as baseline when updating policies and workforce plans.
Source: Bureau of Labor Statistics
Talent Hub Remote Workforce Trends
This section highlights remote-relevant statistics for countries that combine large pools of knowledge workers, strong outsourcing or ICT sectors, and experience serving international clients, all factors that underpin cross-border remote teams and many leaders now see in their own organizations.
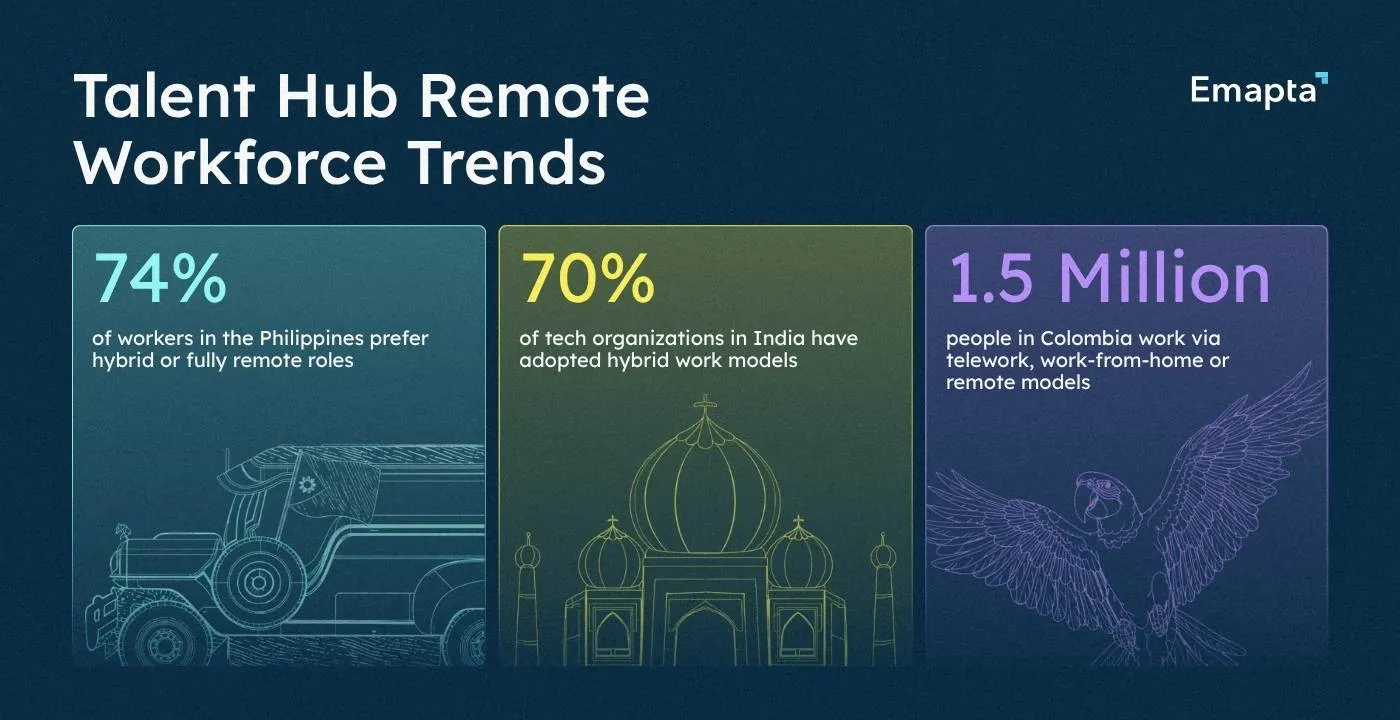
11. 74% of workers in the Philippines prefer hybrid or fully remote roles.
A survey by the Boston Consulting Group shows that 46% of Filipino employees prefer a hybrid work setup and 28% prefer fully remote, meaning almost three-quarters of the workforce actively want flexible, off-site work arrangements.
This indicates a strong orientation toward hybrid and remote work in roles that can be performed online, such as customer support, operations, and knowledge work. That preference is consistently reflected in remote working trends focused on the Philippines and the wider ASEAN region.
Source: Boston Consulting Group & The Network
12. Nearly 70% of tech organizations in India have adopted hybrid work models.
NASSCOM’s Technology Reshaping the Future of Work – India Perspective reports that nearly 70% of organizations in India’s tech industry have adopted a hybrid work model, and that “future of work” technologies enabled remote working for more than 90% of the tech workforce within weeks during the pandemic.
These findings highlight how deeply remote and hybrid models are embedded in India’s IT and business process management (IT-BPM) sector. In many recent remote work statistics across the tech industry, India is frequently cited as an example of large-scale, normalized hybrid adoption.
Source: NASSCOM
13. 1.5 million people in Colombia work via telework, work-from-home or remote models.
Colombia’s ICT ministry (MinTIC) reports that more than 1.5 million people work at a distance under three main arrangements: formal telework, work-from-home arrangements, and fully remote work, based on its national study on telework penetration and perception.
Combined with Bogotá’s role as a bilingual services hub, these remote work trends point to a labor market with substantial experience in remote work modalities, including services delivered to overseas organizations.
Source: MinTIC/Teletrabajo
14. North Macedonia’s €664 million in ICT exports is from a remote-oriented sector.
The ICT Chamber MASIT’s Comparative Analysis of the ICT Industry in Macedonia (data for 2024) shows that the country’s ICT sector:
- Employed 23,948 people in 2024, a 10.7% year-on-year increase, and
- Exported ICT services worth €664 million, serving 37 export markets.
These indicators describe a relatively small but strongly export-oriented ICT sector, where a large share of activity involves cross-border, often remotely delivered, digital services. This kind of export profile is increasingly reflected in comparative remote working stats for emerging digital hubs across Eastern Europe and the Balkans.
Source: Masit
15. In Australia, 36% of employed people usually worked from home in August 2024, up from about 32% in 2019.
Australia’s Characteristics of Employment and Working Arrangements statistics from the Australian Bureau of Statistics (ABS) show that:
- In August 2024, 36% of employed people usually worked from home, slightly down from 37% in 2023.
- This is still about four percentage points above the pre-pandemic level of around 32% in 2019.
The ABS notes that working from home “remains popular” and has stabilized at a much higher level than before 2020, particularly in professional and knowledge-intensive occupations. These Australian working remotely statistics illustrate how flexible arrangements have persisted even as offices reopened and commuting resumed.
Source: Australian Bureau of Statistics (Working Arrangements), Australian Bureau of Statistics Media Release
Remote Work Statistics Before and After COVID
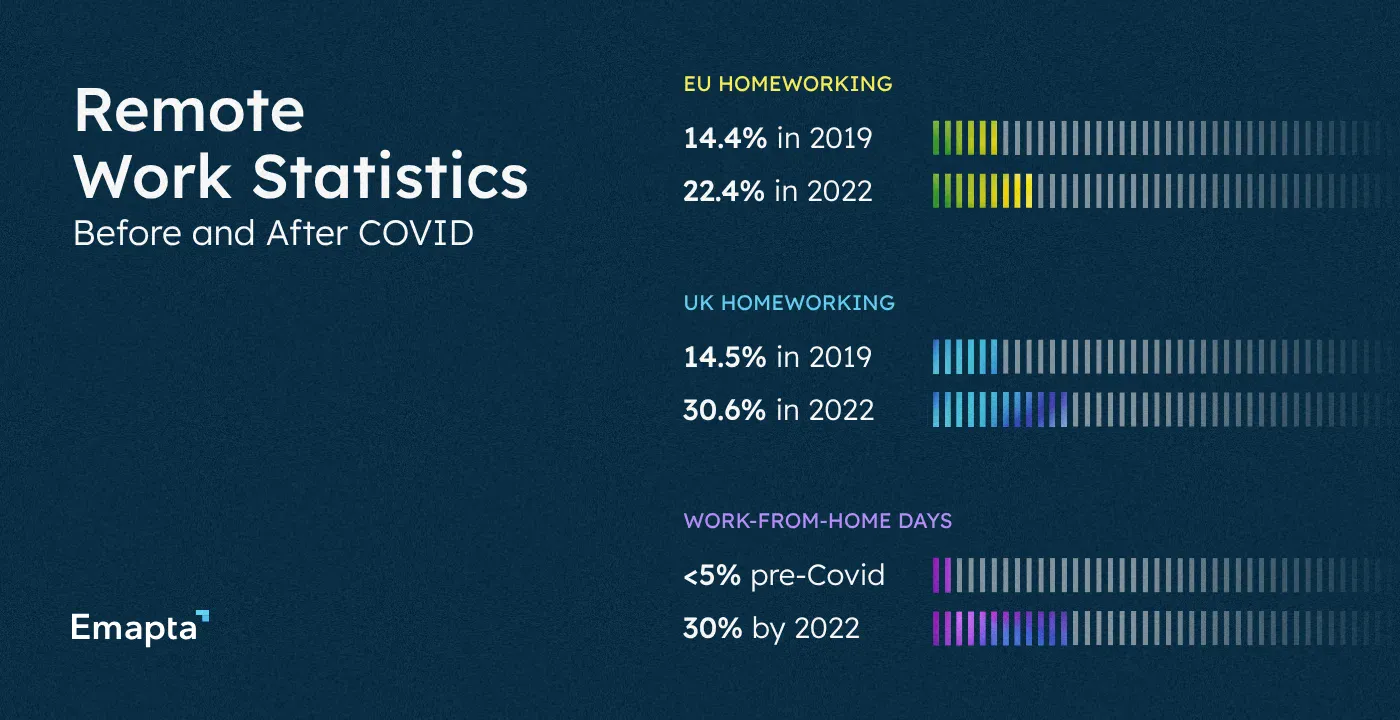
16. EU homeworking rose from 14.4% in 2019 to 22.4% in 2022.
Analysis based on EU Labor Force Survey shows that in the EU-27, the share of employees who usually or sometimes worked from home increased from 14.4% in 2019 to 22.4% in 2022.
Within that, the share usually working from home almost doubled (5.4% → 10.2%), and the share sometimes working from home rose from 9.0% to 12.2%.
Source: Vitola, A. & Christopoulos, G. (2023)
17. UK homeworking doubled from 14.5% to 30.6% between 2019 and 2022.
UK Office for National Statistics (ONS) data show that between October–December 2019 and January–March 2022, the number of people working from home in the UK rose from 4.7 million (14.5% of workers) to 9.9 million (30.6%). According to these remote work statistics, this doubling of homeworking persisted beyond lockdowns and was broad-based across regions, with especially large percentage increases in Scotland and London.
The ONS notes that these new patterns have been accompanied by decreases in traditional commuting and an increase in hybrid arrangements (workers who usually work on-site but spend at least one day per week at home). In many cross-country summaries of working from home stats, the UK is cited as a clear case of how quickly hybrid norms can take root once large parts of the workforce shift away from daily commuting.
Source: Office for National Statistics, Economics Observatory
18. US telework was 35% in May 2020 and about 23% in late 2024.
When the US Bureau of Labor Statistics first added COVID-19 telework questions to the CPS in May 2020, about 35% of employed people reported teleworking or working from home for pay because of the pandemic. By August 2020, that share had fallen to 24%, as workplaces reopened, but remained far above pre-pandemic baselines.
More recent CPS-based analysis finds that by November 2024, 23.3% of US workers did some work from home for pay and 10.9% worked entirely from home, indicating a persistent core of remote and hybrid work post-pandemic. These remote work from anywhere trends illustrate how an emergency response gradually became part of the ongoing mix of arrangements.
Source: US Bureau of Labor Statistics, Pabilonia, S. W. & Vernon, V. (2025)
19. Telework reached about 47% of workers in Australia, France and the UK in 2020.
An OECD review of telework during the pandemic reports that Australia, France, and the United Kingdom each saw around 47% of employed persons teleworking at some stage in 2020. In France, teleworking more than doubled, rising by about 25 percentage points compared with pre-pandemic levels, while in the UK the teleworking rate increased by roughly 20 percentage points, to around 1.8 times its pre-COVID value in April 2020.
These jumps illustrate how rapidly telework scaled during the first year of the pandemic, especially in advanced economies with high shares of knowledge-intensive, office-based work. As cross-country indicators, they form an important backdrop to more recent remote work statistics of 2025 that focus on the post-pandemic equilibrium for remote-capable roles.
Source: OECD
20. Work-from-home days grew from under 5% pre-COVID to about 30% by 2022.
A synthesis of international survey data on working arrangements finds that before the pandemic, less than 5% of full-pay workdays were typically worked from home. During the first lockdown wave in spring 2020, that share climbed above 60% of days in some advanced economies, before declining to around 37% by late 2020 and settling near 30% by August 2022.
By the time more recent remote work statistics from 2024 and 2025 were being compiled, this step-change in work-from-home days was already baked into the baseline. These figures reinforce the idea that while the extreme peaks of lockdown telework were temporary, the post-COVID baseline for remote-capable roles remains several times higher than it was in 2019.
Source: Barrero, Bloom & Davis, US Bureau of Labor Statistics
Conclusion
The latest remote work statistics show a sustained hybrid equilibrium rather than a retreat to 2019. Taken together, this suggest that remote work remains concentrated in knowledge roles and varies by region.
However, it is stable enough to plan around when you’re designing global teams, policies, and office footprints.