
20 Offshoring Statistics You Need to Know in 2026
The latest offshoring statistics show where demand is growing and which locations are performing the best. Looking at these numbers, we can see how teams structure their offshore work to lower costs and improve quality at the same time.
Let’s dive into the trends and see what the future holds.
Key Offshoring Trends for 2026
- Outsourcing contract ACV hit $28.8B in Q1 2025, up 18% year over year
- ITO was $618.1B in 2025 and is projected to reach $732.4B by 2030
- Global BPO was $302.6B in 2024 and is tracking $525.2B by 2030
- The Philippines IT-BPM posted $38B revenue and 1.82M jobs in 2024
- North Macedonia ICT exports reached €664M in 2024 with 23,948 employed
- North America held 32%+ of IT services revenue in 2024, with the US as the largest market
Offshoring Statistics Worldwide [2025 – 2030]
Let’s start off with a few key numbers on a global scale, what companies highlighted, and what are the projections moving forward.
1. Global IT and business services ACV reached $28.8B in Q1 2025.
ISG’s Index points to cloud work growing faster than classic managed services, indicating clear upward trends in offshoring. Teams are responding by adding offshore roles in reliability, FinOps, and platform operations to keep coverage continuous and shorten release cycles.
Source: Information Services Group (ISG) Index Q1 2025
2. IT services delivered by external providers were $744.6B in 2024 and could reach $1.219T by 2030.
The figure spans onshore, nearshore, and offshore delivery. Many companies build offshore depth in security, data platforms, and platform engineering to strengthen expertise and reduce cycle time across products and services.
Source: Grand View Research
3. Finance and Accounting BPO was about $60.3B in 2023 projected to reach about $110.7B by 2030.
According to these offshoring statistics, standardized workflows are commonly supported by steady offshore pods running clear cutoffs, reconciliation checklists, and automation for matching and approvals.
Source: Grand View Research
4. HR BPO reached about $33.3B in 2024 with roughly 10.5% CAGR to 2030.
Global payroll, benefits administration, and recruiting are natural fits for offshore teams that can manage multiple calendars, local regulations, and hiring spikes while keeping data secure.
Source: Grand View Research
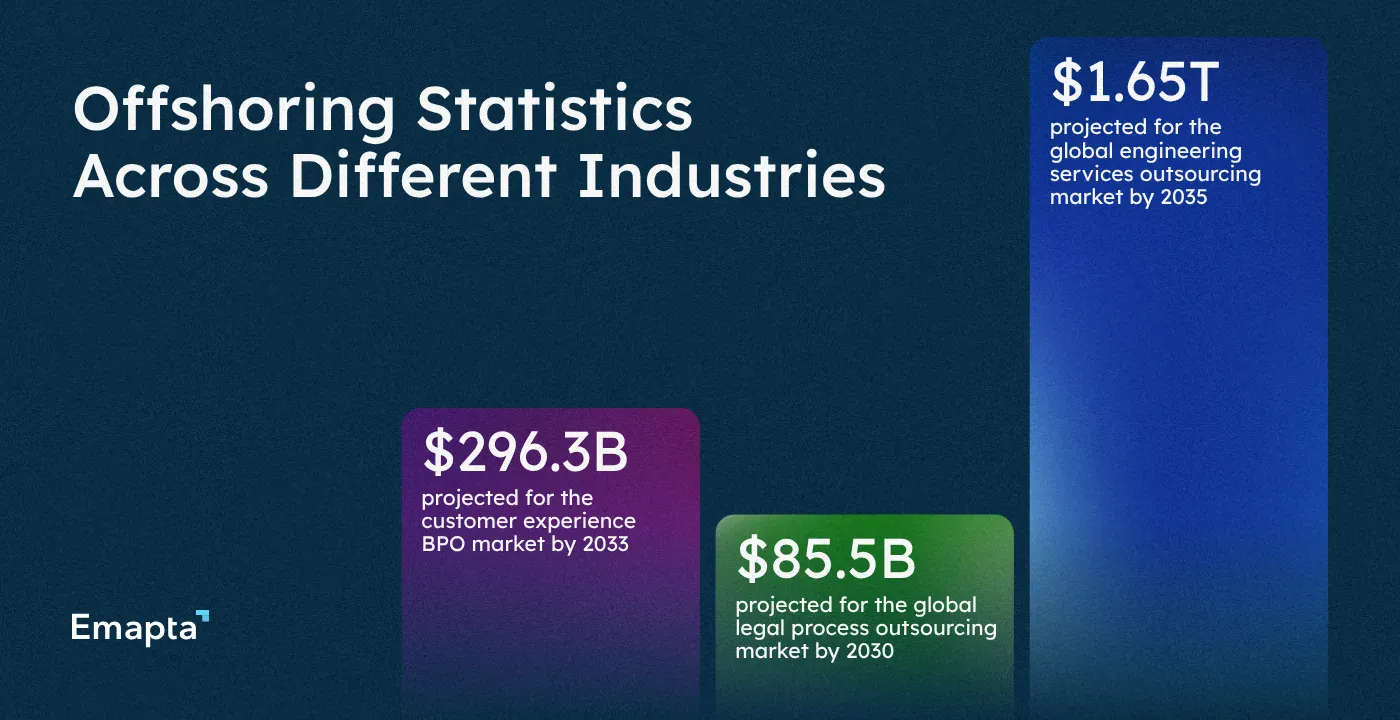
Offshoring Statistics Across Different Industries
5. Customer experience BPO was about $102.0B in 2024 and could reach about $296.3B by 2033.
Offshore CX hubs make 24/7 coverage practical, with multilingual queues, consistent QA, and workforce management that smooths seasonal swings.
Source: Grand View Research
6. Software development delivered by third party teams was about $564.2B in 2025 and could reach about $897.4B by 2030.
What these offshoring jobs statistics tell us is that stable offshore squads keep product context between releases, pair well with agile cadences, and free senior engineers to focus on roadmap work instead of repeat rework.
Source: Grand View Research
7. Legal process outsourcing was about $29.8B in 2025 and could reach about $85.5B by 2030.
Document review, contract lifecycle support, and eDiscovery follow the sun effectively when offshore teams work from tight playbooks with strong confidentiality controls.
Source: Mordor Intelligence
8. Engineering services outsourcing was around $267.5B in 2024 with growth continuing into 2025.
Automotive, aerospace, and electronics programs tap offshore talent for CAD, simulation, validation, and compliance documentation that run reliably against milestone gates.
Source: Business Research Insights
9. Asia Pacific IT services are growing at roughly 11% CAGR through 2030.
Many programs anchor capacity in the region to access deep hiring pools, broad skill coverage, and easier scale-up when new products or markets go live.
Source: Grand View Research
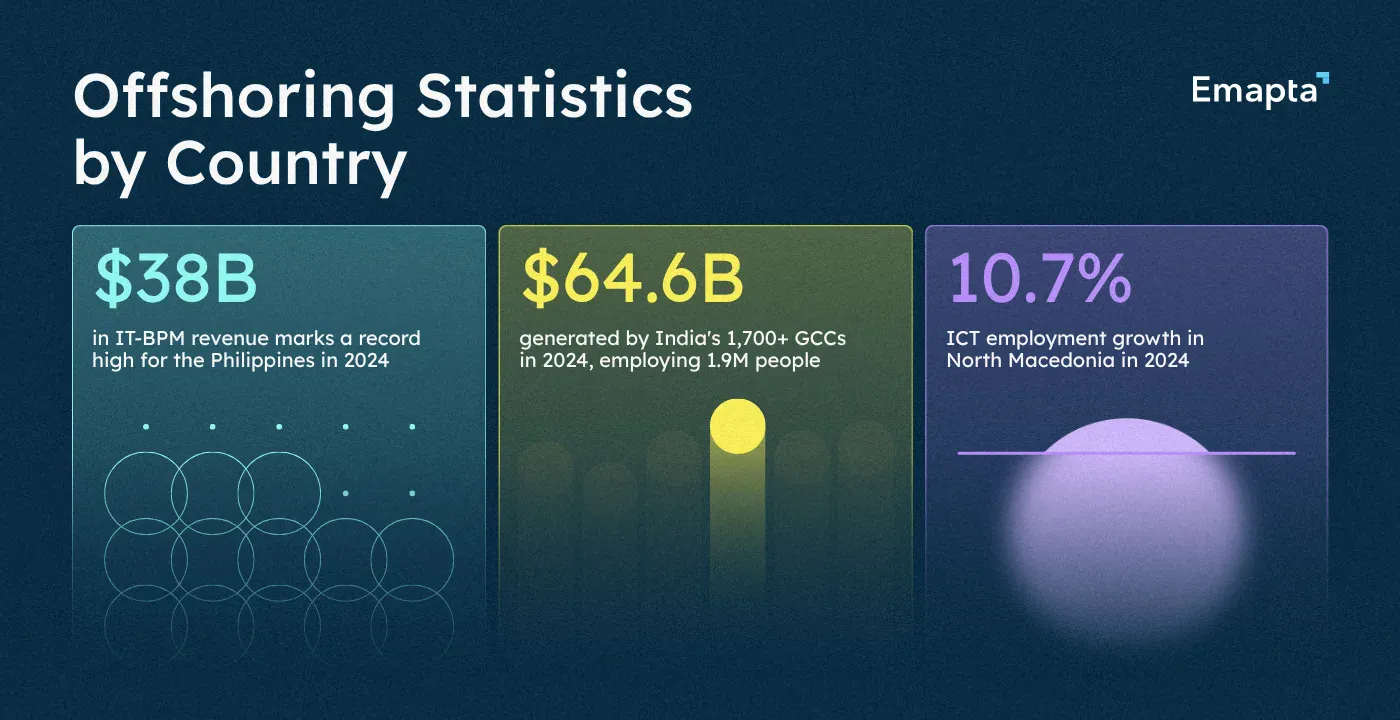
Offshoring Statistics by Country
Three anchor locations stand out for different reasons: India for scale and capability depth, the Philippines for CX and back-office excellence, and North Macedonia for IT enabled services.
10. India had 1,700 plus GCCs generating $64.6B in FY2024 with about 1.9M people.
Global Capability Centers are in-house offshore teams, so enterprises keep standards, data, and IP close while scaling engineering, analytics, and finance. Where a full captive is not in scope, companies often use dedicated staffing via partners that mirror GCC ways of working.
Source: NASSCOM–Zinnov FY2024
11. The Philippines recorded $38B in IT-BPM.
A mature IT-BPM workforce makes CX and back-office builds faster to ramp with steady quality controls and 24/7 coverage when needed. That reliability helps teams forecast headcount and training needs with more confidence.
Source: Reuters, IBPAP
12. The Philippines is targeting up to 2.55M jobs and $59B by 2028.
Growth targets signal strong talent pipelines per the latest offshoring trends. Clear career paths, role ladders, and learning budgets support scaling in step with the market.
Source: Reuters, IBPAP
13. North Macedonia ICT employment rose 10.7% in 2024.
Service exports reached €664M and total headcount hit 23,948, signaling a growing base for software and data roles in a compact, EU-adjacent location.
Source: MASIT 2024 analysis
Offshoring Statistics by Year
A short look at recent movement helps you time budgets and plan capacity changes.
14. Record XaaS ACV rose 30% in Q1 2025.
Cloud-delivered services are taking a bigger share of new commitments, so teams are adding offshore roles in reliability and platform ops to keep round-the-clock coverage.
Source: ISG Index Q1 2025
15. XaaS is expected to grow about 15 to 18% in 2025 while managed services stay close to flat.
Cloud-first work usually adds offshore roles in Site Reliability Engineering, cloud FinOps, and platform operations so handoffs are smooth and uptime targets hold.
Source: ISG Index Q1 2025 outlook
16. Americas demand grew 10% plus in early 2025 for IT and business services.
ISG defines the Americas as North and Latin America, including the United States, Canada, Mexico, and South American markets. Teams that align release and support hours with local peak activity tend to maintain responsiveness as demand rises.
Source: ISG regional summary
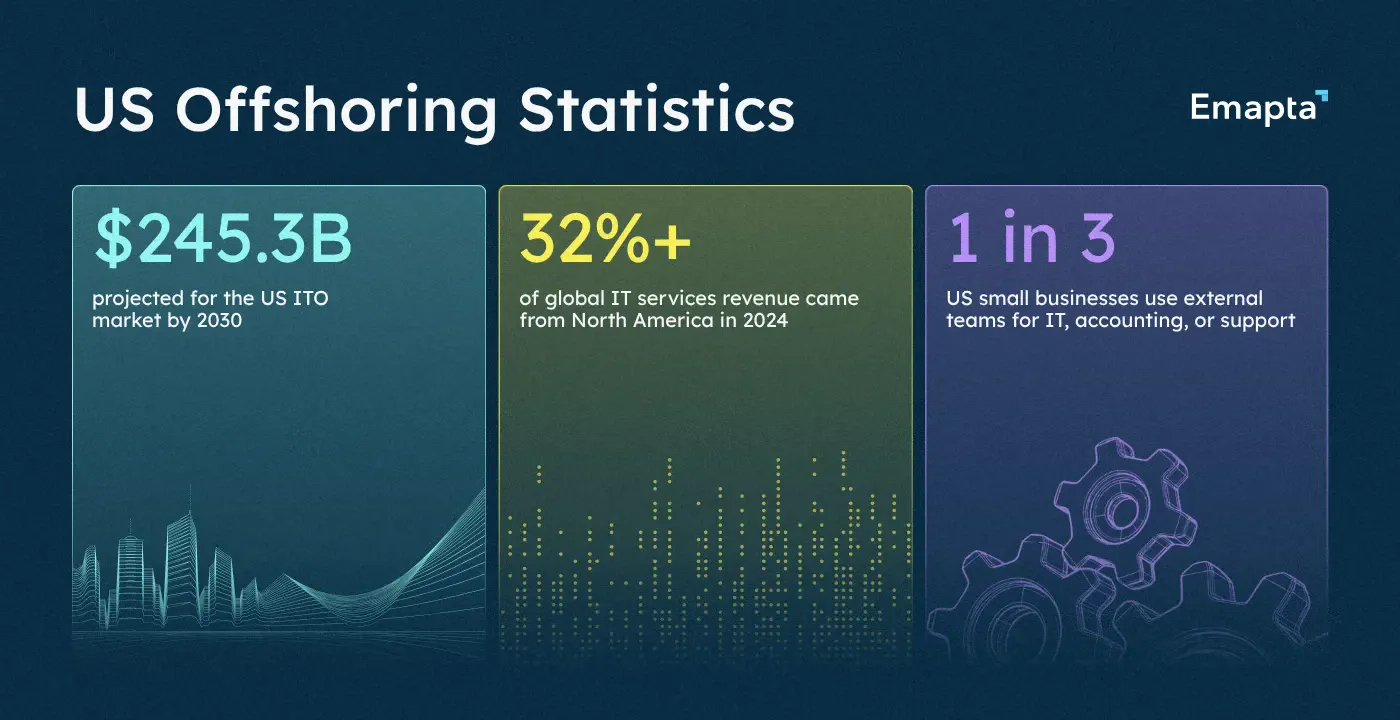
US Offshoring Statistics
US demand shapes a large share of global delivery, so it helps to see how US organizations structure and staff offshore work.
17. US ITO market was $191.3B in 2025 and is projected to reach $245.3B by 2030.
Growth is fueled by demand for 24/7 coverage and wider skill access, with a meaningful share staffed offshore. According to these statistics, the US ITO market will see an increase of about 28.2% within the next 5 years.
Source: Mordor Intelligence
18. More than 1/3 of US SMBs use external teams for IT, accounting, or support.
The latest IT offshoring trends suggest more than a 30% use of external teams in IT, accounting, and support. That is a common entry pattern is a single, well-documented process with a small offshore pod, followed by gradual expansion as accuracy and cycle time stabilize.
Source: Clutch SMB research
19. About 60% of Finance and Accounting vendor contracts were projected not to renew by 2025.
Many organizations are moving from vendor-led models to dedicated offshore finance teams under their own governance, which keeps tooling choices and audit standards in-house while modernizing workflows.
Source: Gartner-covered outlook
20. North America held over 32% of IT services revenue in 2024 with the US the largest market.
According to these IT offshoring statistics, programs with clear service levels, defined responsibilities, and practiced daily handoffs tend to maintain momentum across time zones.
Source: Grand View Research
Wrapping Up
The 2026 offshoring picture is scale with control. Cloud-first work and always-on support keep demand strong across IT, CX, and finance, with stable growth in engineering and legal services as well.
These offshoring statistics state that Asia Pacific remains the capacity engine, while Central and Eastern Europe deepen multilingual finance and compliance. India and the Philippines continue to lead on depth and volume, with emerging hubs like North Macedonia adding niche IT experts.