20+ Renewable Energy Statistics & Trends for 2026
The world is rapidly committing to clean electricity. For the past two years, renewable energy statistics show us that this industry reaches new records in generation, capacity, and investment.
The surge in energy storage in the US and EU’s substantial investments in renewables, alongside China’s extensive solar deployment, show us how solar energy is becoming a key player in this revolution, highlighting a significant growth.
Let’s dive into the numbers and analyze the current and future standing of the renewable energy industry.
Renewable Energy Trends 2025 – 2026 | At a Glance
- Renewables made up 92.5% of all new power additions globally
- Solar supplied 81% of new renewable capacity
- Renewables reached 34.3% of global electricity in H1 of 2025
- China added 434 GW of renewables in 2025
- Solar and wind met 100% of global electricity demand growth in Q1-Q3 of 2025
- Global renewable capacity reached nearly half of all installed power worldwide
- Renewables supply 100% of new global electricity demand growth
- Clean energy investment hit a record USD 386 billion in H1 of 2025
Global Renewable Energy Statistics
From record-breaking additions to rising generation and investment, clean energy is becoming the backbone of global electricity. The following section explores the key drivers behind this transformation, and what’s still holding it back.
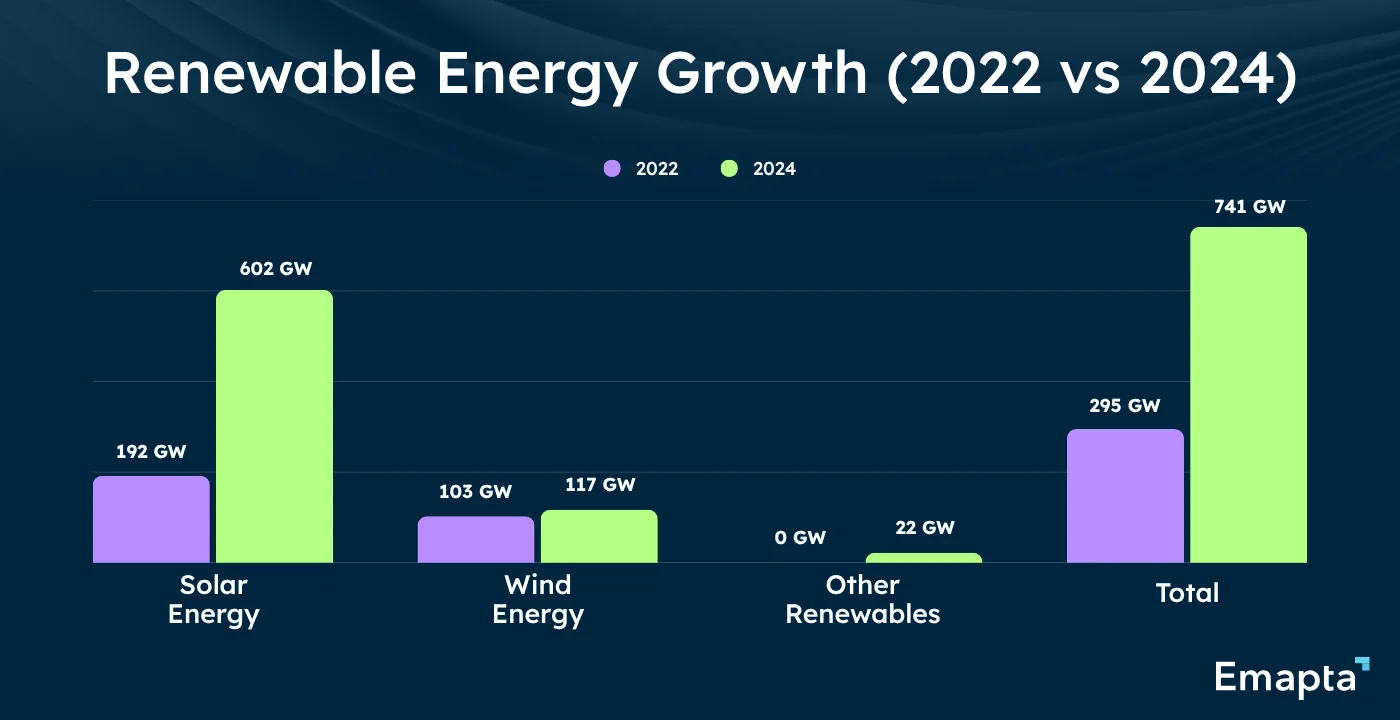
1. Record 741 GW Added in 2024, 92.5% of All New Electricity Additions.
With an 18% annual growth rate, solar and wind supplied roughly 96% of these new additions. This cements their role as central technologies driving the energy transition.
Why it matters: This represents an irreversible shift in how the world builds power infrastructure. Clean energy is now the default option, not a niche solution.
Source: REN21
2. 602 GW of Solar Added in 2024, 81% of All New Renewable Capacity.
Statistics about renewable energy indicate that wind added a record 117 GW, bringing total global wind capacity above 1,100 GW for the first time. Most growth came from China and a few other countries.
Why it matters: While solar growth is cooling from unsustainable peaks, it remains the fastest-scaling power source globally. Wind needs policy support and permitting reform in regions outside China to unlock comparable expansion.
3. 1,000+ TWh Extra Electricity was Generated by renewables in 2025.
In the first three quarters of 2025, solar and wind together met 100% of global electricity demand growth. Every additional unit of power the world needed came from clean sources, not fossil fuels.
Why it matters: These renewable energy statistics from 2025 prove that renewables can scale fast enough to meet growth in electricity demand without adding coal or gas capacity. The transition is self-sustaining at the margin.
Source: Ember
4. Growth Rate of 800 GW is Below the COP28 Triple Renewables Pledge.
Closing this 800 GW shortfall requires lifting annual additions from today’s 741 GW to about 1,100 GW per year, a 48% acceleration. That demands faster grid expansion, clearer policies, and better access to finance in emerging markets.
Why it matters: The pace is technically and economically achievable, but not automatic. Policy certainty, investment flow, and grid infrastructure must all improve immediately.
Source: REN21
5. Renewables Surpassed Coal as Primary Energy Supply in 2025.
In the first half of 2025, renewables supplied 34.3% of global electricity, finally surpassing coal’s 33.1%. This marks the first time in over a century that renewables topped coal in the global power mix.
Why it matters: This crossover confirms the energy transition is no longer hypothetical. It is underway and structural and it does not dependent on subsidies or policy preferences alone.
Source: World Economic Forum
Renewable Energy Stats – Growth & Latest Trends
Renewable energy has experienced substantial growth over the years, and trends indicate this will continue in the future. Let’s see how this industry has grown and the latest developments over the last few years.
6. 117 GW Wind Energy Added in 2024.
Most of this growth came from China and a few other countries, with wind growth in the rest of the world notably weak. This geographic imbalance shows how concentrated renewable energy levels remain.
Why it matters: Unless wind policies improve globally, particularly through permitting reform and long-term auction schedules, countries outside China will struggle to meet 2030 renewable energy targets.
7. Historic Growth – 2,500+ TWh Solar in 2025.
According to the latest renewable energy statistics, no other electricity source has grown this fast from such a large base. Even with slower percentage growth, solar remains the main technology cutting power-sector emissions worldwide.
Why it matters: Solar’s dominance in renewable energy trends reflects its genuine cost advantage and deployment speed compared to all alternatives. No subsidies are required to compete in most markets.
8. Record in Renewables Investment – $386 Billion in H1 of 2025.
Up 10% from the same period in 2024, it was the strongest half-year ever recorded for clean power funding, signalling renewed investor confidence in renewable energy trends.
Why it matters: After 2024’s slowdown, renewable energy facts show that funding is accelerating again when policy is predictable. This proves the capital is available; policy certainty is the constraint.
Source: Bloomberg
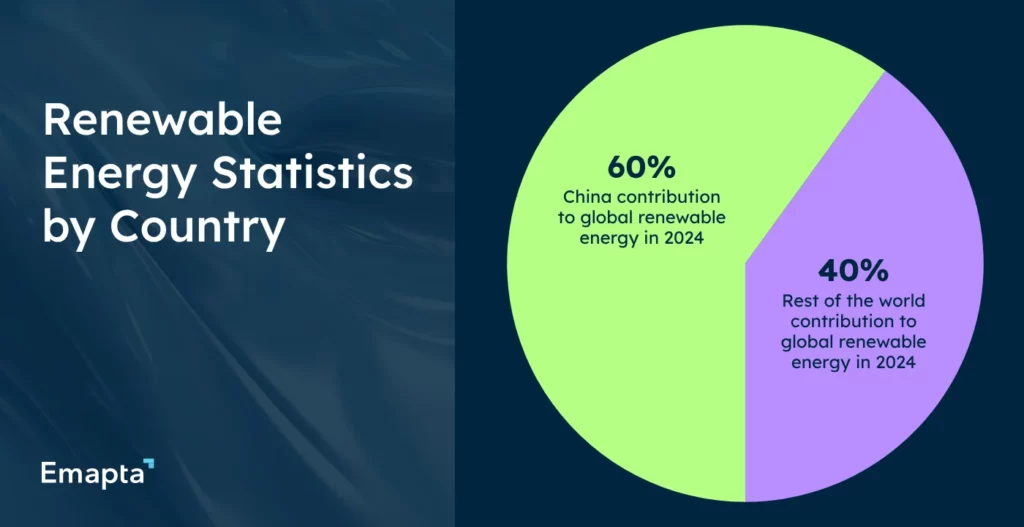
9. 60% of Global Renewables Come from China in 2024.
The global growth of clean energy relies heavily on China’s policies and economy. If China slows down its progress, it could halt the worldwide shift toward renewable energy.
Why it matters: It’s important for more countries to take action to reduce their reliance on China’s pace and stability. This reliance creates risks in an otherwise positive trend for energy transition.
10. ESO Market, Worth USD 1.7 Trillion by 2032.
The global energy engineering services outsourcing (ESO) is also projected to grow at 18.2% annually. Developers outsource grid studies, protection design, and commissioning to specialized firms because it cuts approval times and reduces delays.
Why it matters: Renewable energy statistics show us that specialized engineering services are becoming core to project speed and cost control. That said, outsourcing reduces bottlenecks that often delay projects by years.
Sources: Mordor Intelligence, Straits Research
11. Wind O&M Outsourcing Rise to Unseen Performance Levels.
Outsourced operation and management (O&M) reduces unplanned turbine outages, improves energy yields, and lowers lifetime costs per megawatt. As wind fleets age and developers seek leaner operations, specialist service companies are becoming essential partners.
Why it matters: Outsourcing O&M improves renewable energy by raising turbine uptime and yield across aging fleets. This is a passive way to extract more value from existing capacity without new builds.
Renewable Energy Statistics by Country
These numbers reveal how China, the US, the EU, and other emerging economies are reshaping their power systems with solar, wind, and batteries. The following stats highlight what leadership in clean energy looks like.
12. China Added 434 GW of Renewables in 2025.
No other country has ever reached this level of annual additions. China’s energy efforts prove that aggressive industrial policy, grid planning, and manufacturing scale can unlock unprecedented clean energy deployment. According to these worldwide renewable energy statistics, China added a whipping 434 GW of renewables in 2025 alone.
Why it matters: China’s trajectory demonstrates the world can build renewable capacity at the speed needed for climate goals. The question is whether other nations can replicate the policy and investment model.
Source: PV Magazine
13. Renewable Energy comprises 91% of New US Capacity in H1 of 2025.
Solar accounted for 75% of new additions, cementing its role as US top new power source. Utility-scale solar now represents more than 11% of total US installed capacity and has been the leading source for two consecutive years.
Why it matters: These renewable energy industry statistics show a clear shift toward solar dominance. Despite wind’s earlier leadership role, falling solar costs and rapid permitting have made it the default choice for new capacity.
Source: Solar Power World
14. 58.8% of Energy in Germany in 2025 Comes from Renewables.
Germany set new solar generation records in every quarter of 2025, thanks to rooftop systems and large solar farms. Its experience highlights the importance of grid upgrades and flexible resources to handle high shares of variable renewables.
Why it matters: Germany’s renewable energy trend show that industrial nations can achieve 60%+ clean power shares without sacrificing economic growth or reliability. It’s a proven model for other advanced economies.
Source: SMARD
15. 88% Energy Generated from Renewables in Brazil in 2024.
Hydropower remains the backbone, but newer renewable energy features, such as solar and wind, are growing quickly. Statistics on renewable energy show that Brazil’s combination of strong natural resources, policy support, and financing has become a reference point for emerging markets.
Why it matters: Brazil’s renewable energy policies demonstrate that developing nations can build low-carbon power systems without sacrificing affordability. This marks a critical proof point for emerging markets with energy access gaps.
Source: PV Magazine
16. India is the Second-Largest Solar Energy Market Worldwide.
India reached 50 GW of installed wind capacity in early 2025 and added about 24.5 GW of solar in 2024, making it the world’s second-largest solar market after China.
Why it matters: India’s energy landscape show that emerging economies can combine rapid deployment with massive electrification needs, solving two critical challenges simultaneously.
Sources: IRENA, Carbon Credits
17. 7.5 GW of Renewables Added in Australia in 2024.
Australia is not falling behind the other countries as the latest renewable energy statistics from 2024 indicate. Rooftop solar has led the country’s renewable energy efforts for five consecutive years. More than 300,000 new rooftop systems were installed, and small-scale solar now generates over 12% of Australia’s electricity.
Why it matters: Australia highlights the growing role of distributed rooftop solar in meeting 2030 targets. Residential deployment removes infrastructure bottlenecks and engages communities directly.
Sources: Clean Energy Regulator, Clean Energy Council
Renewable Energy Statistics Per Year
The last four annual snapshots show the rise of solar, the decline of coal, and the surging growth of storage. Year by year, the numbers tell the story of a fast-moving shift toward clean power, and the challenges that are still ahead of us.
18. Renewables Surpass Coal in the US in 2022.
Globally, 295 GW of renewable capacity was added, with solar making up roughly two-thirds of that growth. In the US, this marked the point where renewable energy outpaced fossil fuels in new builds for the first time in history.
Why it matters: Renewable energy statistics from 2022 show that renewable energy was not just speculative. The numbers show they were actively transforming the power sector, surpassing traditional sources in major energy markets like the US.
Sources: IRENA
19. Renewables Hit 30% of Global Electricity in 2023.
According to the renewable energy statistics in 2023, solar also overtook hydropower as the largest single renewable source globally, a major shift in renewable energy trends. Hydro had led for decades but now grows much more slowly than solar.
Why it matters: This milestone confirmed the energy transition is structural and accelerating, not dependent on near-term subsidies or political cycles.
Source: Ember
20. 741 GW were Added in 2024, marking a New World Record.
In 2024, the world added a record 741 GW of renewable capacity, with renewables accounting for 92.5% of all new power-plant capacity. Solar and wind dominated these renewable energy trends.
Why it matters: Global renewable energy statistics from 2024 proved that the pace needed to hit 2030 targets is technically achievable. The question is political will and policy continuity.
Sources: REN21, ManagEnergy
21. Renewable Energy Surpass Coal Globally in 2025.
In the first half of 2025, renewable energy made up 34.3% of global energy use, while coal represented 33.1%. That year, China added 434 GW of renewable energy, including 315 GW from solar power and 119 GW from wind power.
Why it matters: 2025 marks a significant change. Renewable energy now leads in new energy capacity worldwide and we have permanently shifted toward cleaner energy sources.
Sources: World Economic Forum, PV Magazine
Future Renewable Energy Trends & Industry Outlook Through 2030
Lastly, the renewable energy industry looks set to continue its dominance worldwide. With good reason too, as the world needs a much cleaner and sustainable energy source. Let’s see what the future has in store.
22. 4,600 GW New Renewables by 2030.
IEA’s projection expects to double today’s installed base roughly, solar is expected to account for 80% of this growth. Still, that forecast is 5% lower than the previous one due to policy uncertainty and rising financing costs in some markets.
Why it matters: The decade outlook shows that renewabe energy over the next 5 years is critical to hitting climate goals. Policy and investment decisions made in 2025–2026 will largely determine success by 2030.
Source: Energy Tracker Asia
23. China is expected to Add 400+ GW Annually.
Based on the latest projections and renewable energy statistics, China have a 5-year plan. From 2025 to 2030, they will be driven by energy security, air quality, and industrial strategy. Because China already dominates the global renewable energy sector, its momentum is central to achieving worldwide climate goals.
Why it matters: Strategic dependency shows the transition’s success depends heavily on China’s policy continuity. Diversifying beyond China is essential for resilience, even though China’s current trajectory is aligned with global needs.
Sources: PV Magazine, CarbonCredits
24. US Renewable Energy Set to Increase in the 2025-2028 Period.
92 GW of utility-scale solar projects are scheduled for 2025-2028, far exceeding current annual build rates. This pipeline reflects strong economics and lasting policy support through the Inflation Reduction Act.
Why it matters: US renewable energy efforts are beginning to match China’s deployment pace in solar capacity. The 92 GW pipeline alone could double current annual builds once permitting accelerates.
Sources: Solar Power World, Electrek
25. 42.5% Renewables is a Target for EU by 2030.
In electricity alone, renewables are already above 45%, with some countries far ahead. The latest UK renewable energy statistics suggest that to hit this target, EU countries must roughly double deployment pace from the past decade and invest heavily in grids and permitting.
Why it matters: EU renewable energy target is difficult but possible if policy holds steady. The target requires sustained investment and permitting reform, politically challenging but technically feasible.
Wrapping Up
Numbers leave no room for doubt as renewable energy is no longer an alternative, it is the foundation.
With solar and wind covering all new electricity demand growth, and renewables overtaking coal globally, the energy transition has officially entered a new phase.
However, momentum alone won’t close the 800 GW gap to meet 2030 goals as renewable energy statistics suggest. Hitting those targets means scaling faster, building smarter, and investing wider.
Frequently Asked Questions (FAQ)
Renewables account for 8.1% of total global energy (2024), but this varies significantly by sector. In electricity generation specifically, renewables provide 30% globally, and reached 34.3% in H1 2025, surpassing coal for the first time.
The top 10 facts about renewable energy are the following:
- A single wind turbine generates enough electricity to power 1,400+ homes annually.
- Spain’s solar plants use molten salt technology (500¬∞C+) to store solar energy for up to 7 hours after sunset, powering grids overnight.
- Solar capacity exploded 214% in just two years-from 192 GW (2022) to 602 GW (2024)-making it the fastest-growing energy source globally.
- In Q1-Q3 2025, solar and wind met 100% of global electricity demand growth; every new watt came from renewables, not fossil fuels.
- Solar and wind supplied 17.6% of global electricity in H1 2025, up from 15.2% in H1 2024-a dramatic acceleration.
- China dominates renewables with 60% of global capacity additions (2024)-more than the rest of the world combined, underlining geopolitical dependency risks.
- Renewables now account for 92.5% of all new global power capacity. In 2024, only 7.5% of new generation came from fossil fuels.
- Tech giants lead the “green internet”: Apple achieved 83% renewable energy usage, Facebook 67%, both committing to 100% renewable new data centers.
- Renewable energy generates 3-5 times more jobs than fossil fuels, making the green sector the fastest-growing employment source globally.
- Stanford research and the WWF show the world can achieve 100% renewable power by 2050, meeting all global electricity needs without fossil fuels.
No, it isn’t true thet 40% of US energy comes from nuclear power plants. In reality, nuclear provides only 18–18.6% of US electricity generation (2023–2024), not 40%. That said, nuclear remains a significant carbon-free source but nowhere near 40% of overall US energy.
China is the no.1 country in renewable energy. It leads globally in renewable energy by most metrics:
- 1,400 GW total installed capacity (half the world’s total)
- 32% of global renewable electricity
434 GW added in 2025 alone